|
|
Post by theMist on Nov 22, 2018 13:30:35 GMT -5
S&P Daily ChartWell, thought might get one more little rally BUT if that neckline gets tested and breaks could be looking at move to SP2300 without a year end Santa Rally This year resembles a H&S top and was thinking right shoulder might have more to go but not so sure now...we'll see... the selling has been relentless and can remain that way for quite some time 
|
|
|
|
Post by theMist on Nov 22, 2018 13:34:31 GMT -5
S&P Weekly Chart
That rising support should get tested...weekly indicators still bearish 
|
|
|
|
Post by walnut on Nov 23, 2018 1:11:34 GMT -5
Seems like it could go either way, look at the divergent RSI, and the bottomed out daily TSV. Also, has almost hit bottom on the daily stochastics. Those indicators look encouraging, but weekly and monthly indicators look quite scary and could take the market right past the daily indicators. Also, the FANG stock indicators generally look worse than this at this point. The 2018 monthly indicators with two drops in the year look similar to the 2015- 2016 period, which was no picnic. It would be great if this mirrors the tail end part of that double drop period.  |
|
|
|
Post by huh on Nov 23, 2018 8:38:18 GMT -5
VXX playing yet with the shoulder test line of its larger H&S. If it fills the upside gap now @39.34 (purple arrow), then falls back down through the shoulder test line (upper line), that would be very bullish for markets. If not, then bulls are broken. JMHO 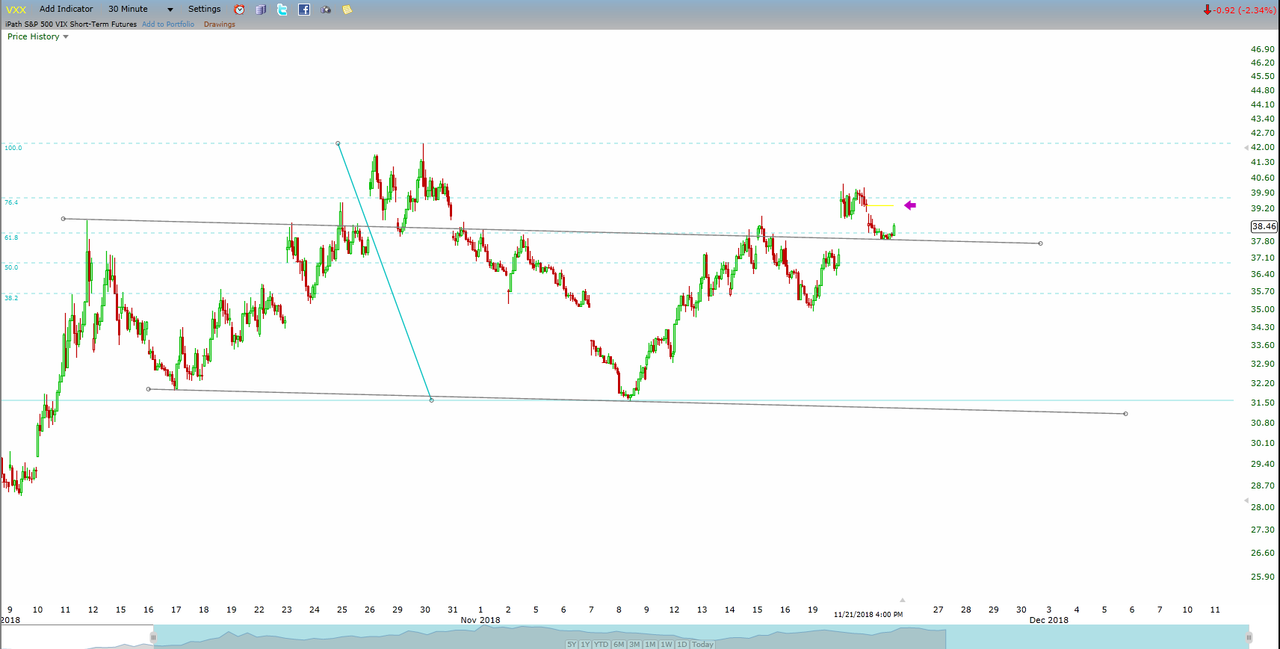 |
|
|
|
Post by huh on Nov 23, 2018 8:40:58 GMT -5
Here's a look at that same VXX chart, but on the Daily view (note the still open gap down near its all-time lows): 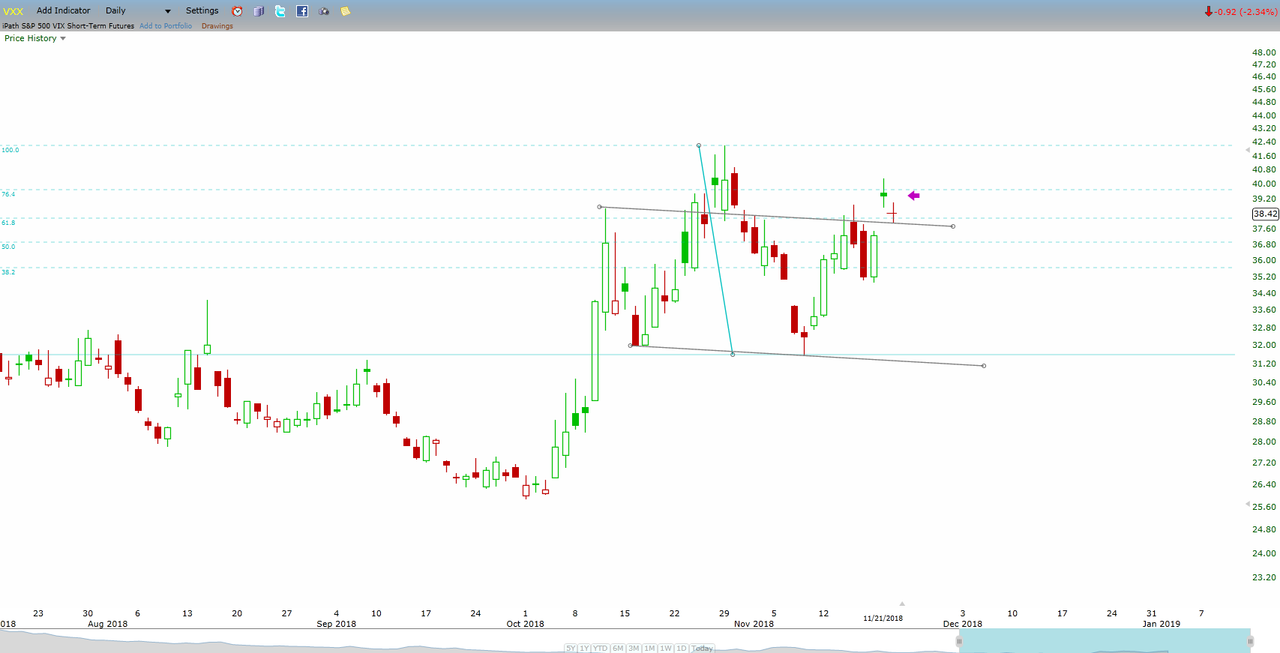 |
|
|
|
Post by clinton on Nov 23, 2018 9:36:01 GMT -5
LONG USO calls seems like a no brainer
|
|
|
|
Post by theMist on Nov 23, 2018 9:50:56 GMT -5
Don't forget the gap in VXX at 44 range  |
|


