|
|
Post by huh on Jan 11, 2017 7:55:39 GMT -5
10 things you need to know before the opening bell The World Bank says global growth will pick up slightly in 2017. The World Bank has lowered its 2017 global growth forecast to 2.7% from its June outlook of 2.8%, but that would still be ahead of the 2.3% growth that was experienced in 2016. US oil output is expected to rise in 2017 and 2018. A report released by the US Energy Information Administration on Tuesday showed US crude-oil production was expected to increase by 110,00 barrels a day in 2017 to 9 million and by another 300,000 barrels a day in 2018. West Texas Intermediate crude oil is higher by 0.8% at $51.20 a barrel. The Turkish lira tumbles to another record low. The currency is down 2% at 3.8657 per dollar, running its 2017 loss to about 9% just eight trading days into the new year. The lira slumped 17% in 2016. Francois Fillon is ahead in the French polls. The conservative former prime minister holds a 64%-to-36% edge over far-right leader Marine Le Pen and a 52%-to-48% lead over independent Emmanuel Macron. The runoff is scheduled for May. Italy's 5-Star Movement has reentered its alliance with UKIP. The antiestablishment party was rejected in its bid to form an alliance with pro-European Union Liberals, and it has reentered its alliance with the UK's UKIP party, Reuters says. The US has charged 3 FX traders with currency rigging. Traders Richard Usher, who worked at Royal Bank of Scotland and JPMorgan; Rohan Ramchandani, an-ex Citi banker; and Christopher Ashton, a former employee of Barclays, were charged with "conspiring to fix prices and rig bids for US dollars and euros exchanged in the FX spot market," the Department of Justice said in a statement. Jeff Gundlach says the bond bull market is dead if the 10-year hits 3.00%. During the presentation of his 2017 outlook, Gundlach said a move to 3.00% and above would have "a real impact on market liquidity in corporate bonds and junk bonds." Part of the New York Stock Exchange is going electronic. Floor trading on the New York Stock Exchange's NYSE MKT exchange, which lists about 250 small-cap names, will soon be fully automated thanks to new technology, Reuters reports, citing a regulatory filing. Stock markets around the world are higher. Hong Kong's Hang Seng (+0.8%) paced the gains in Asia, and Germany's DAX (+0.3%) is out front in Europe. The S&P 500 is set to open little changed near 2,268. Earnings reports trickle out. KB Homes will report after markets close. www.businessinsider.com/opening-bell-january-11-2017-2017-1 |
|
|
|
Post by huh on Jan 11, 2017 7:56:39 GMT -5
|
|
|
|
Post by huh on Jan 11, 2017 8:01:16 GMT -5
Frontrunning: January 11 Russia likely main topic in Trump's first news conference since election (Reuters) Russia Denies Report It Has Compromising Material on Trump (BBG) For Russia, U.S. election meddling claims strip Trump win of luster (Reuters) Obama Urges Unity in Farewell Speech (WSJ) 1930s-like Demographic Pressures Holding Back U.S. Economy (BBG) ... www.zerohedge.com/ |
|
|
|
Post by theMist on Jan 11, 2017 8:33:59 GMT -5
S&P Futures Chart  |
|
|
|
Post by huh on Jan 11, 2017 8:45:58 GMT -5
Finally, I figured out how to turn off those news/economic/dividends/pattern marks (circles with N, E, D or P) on the futures charts. Simply right click the on the chart and select "Hide Marks On Bars"
|
|
|
|
Post by theMist on Jan 11, 2017 8:47:49 GMT -5
walnut,
from our friend - "I don't disagree. But the most I can lose is the difference between the price points. What I haven't been able to figure out yet, is what rolling would be like. For instance, lets say I own March $15 calls on UVXY and have sold this weeks $7 call. If we have a 20% stock market crash in the meantime, I would have had to continually roll that weekly call, because UVXY would be up at least 500%. We'll say it is now trading at $35. I should be able to theoretically take the loss at that point of $8, or I could keep rolling the short $15/$7 call spread week to week (probably more like month to month), until UVXY comes back down to $7. I could take a few months, my biggest concern Is I cannot quantify how much more the premium on the $15 call would be compared to the $7 call. So because of that, I cannot calculate how long I can continue to roll. In 2011 it would have taken about 3 months. In 2008/9 it would have taken about 1 year."
"This is why I am doing this with just a few options right now, until I see how this works in a crash. 20%+ crashes are rare, however I have to know I can survive. If I can double my money every 6 months, I won't mind losing 50% every 10-20 years. There have been 25 20%+ declines, which includes 12 between 1929 and 1940."
|
|
|
|
Post by theMist on Jan 11, 2017 8:48:33 GMT -5
Finally, I figured out how to turn off those news/economic/dividends/pattern marks (circles with N, E, D or P) on the futures charts. Simply right click the on the chart and select "Hide Marks On Bars" Thanks Huh. They tend to drive you crazy. lol |
|
|
|
Post by huh on Jan 11, 2017 8:55:32 GMT -5
I'm seeing the H&S target ~2245.50 by measuring the H&S shorter on the width (red lines). However, I wonder if we won't see something like this: A drop down to ~2254 (left arrow), then a pop back up to ~2266-2267 (right arrow). This would form a larger H&S (dashed green lines), and complete the max peak for a RS of this smaller H&S. It's one possibility at least. Either way, I think 2266-2267 is important resistance now. (S&P low to mid 2270's) 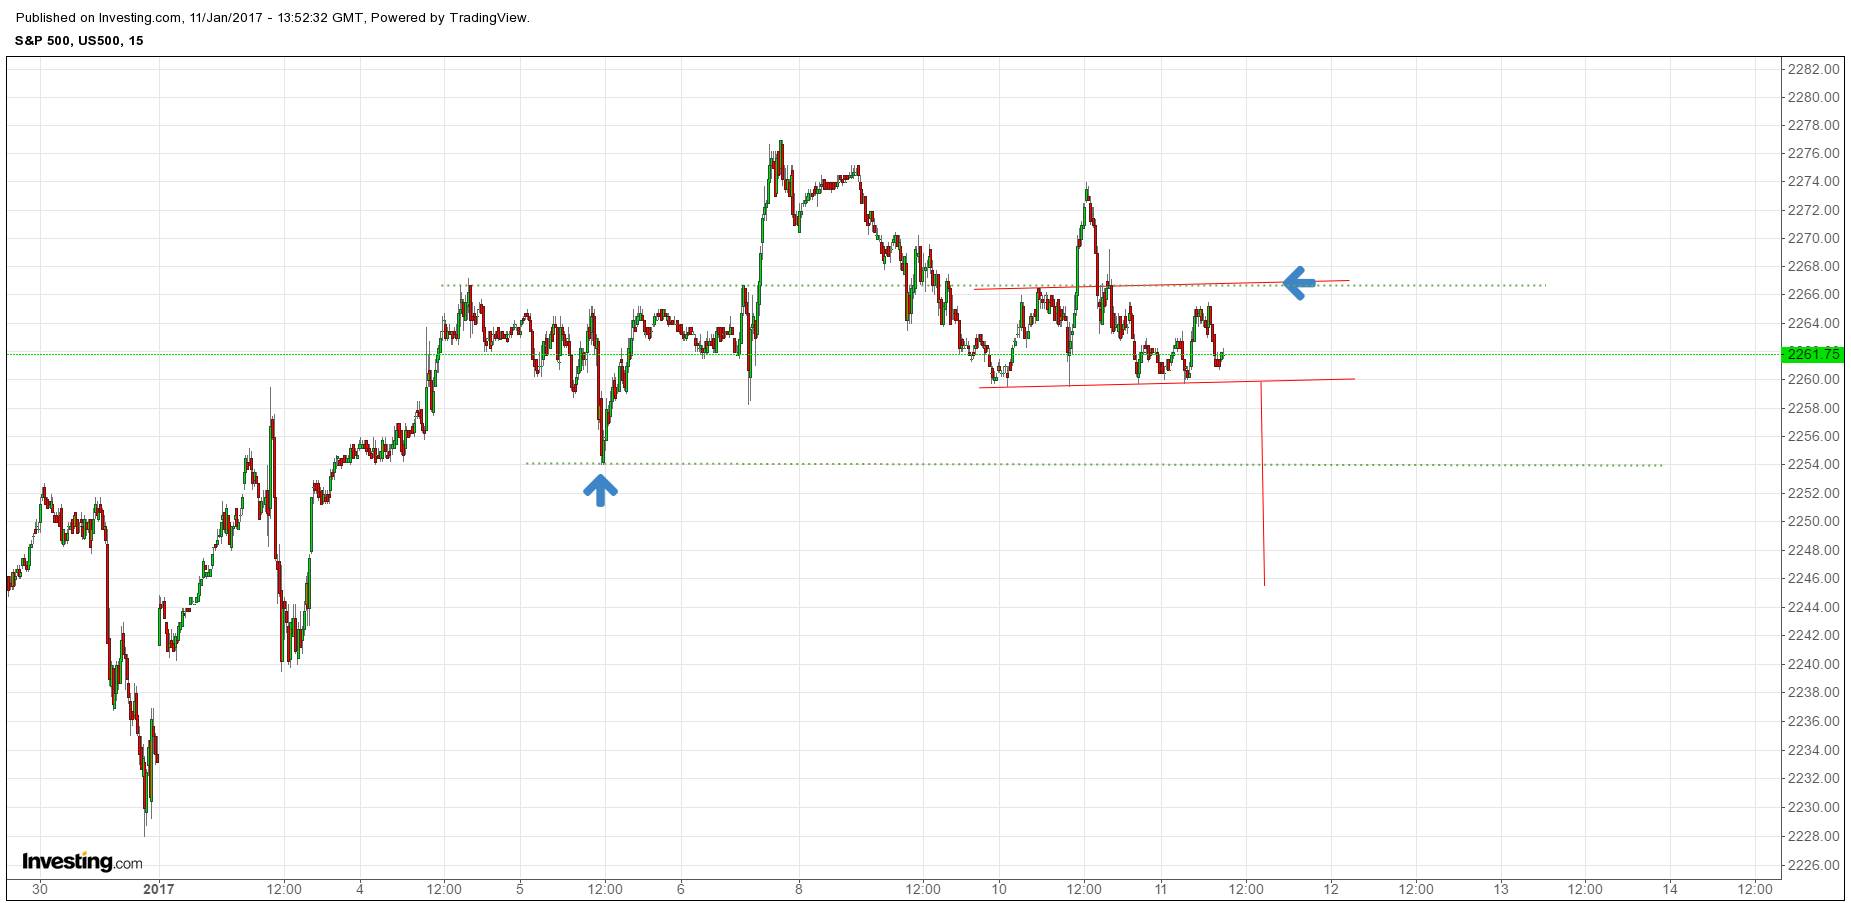 |
|
|
|
Post by huh on Jan 11, 2017 8:57:48 GMT -5
Another chart tip:
Use the camera icon in the top right corner to get a link to a picture of your chart. Click "Copy Link" in the window that opens and post it here as you would normally using the insert picture button.
Although the window with the link takes a few moments to generate, it saves you from having to crop the picture, save it locally, then upload it.
|
|
|
|
Post by walnut on Jan 11, 2017 9:13:23 GMT -5
walnut, from our friend - "I don't disagree. But the most I can lose is the difference between the price points. What I haven't been able to figure out yet, is what rolling would be like. For instance, lets say I own March $15 calls on UVXY and have sold this weeks $7 call. If we have a 20% stock market crash in the meantime, I would have had to continually roll that weekly call, because UVXY would be up at least 500%. We'll say it is now trading at $35. I should be able to theoretically take the loss at that point of $8, or I could keep rolling the short $15/$7 call spread week to week (probably more like month to month), until UVXY comes back down to $7. I could take a few months, my biggest concern Is I cannot quantify how much more the premium on the $15 call would be compared to the $7 call. So because of that, I cannot calculate how long I can continue to roll. In 2011 it would have taken about 3 months. In 2008/9 it would have taken about 1 year." "This is why I am doing this with just a few options right now, until I see how this works in a crash. 20%+ crashes are rare, however I have to know I can survive. If I can double my money every 6 months, I won't mind losing 50% every 10-20 years. There have been 25 20%+ declines, which includes 12 between 1929 and 1940." Not really wanting to analyze this one further cause I have seen enough haha, But: The most you can lose is NOT just the difference between the price points if the short and near term calls delta spikes up very high and the price jacks up very high early on, the long term calls that you bought as a hedge deltas are going to respond much more slowly because their gamma is lower. That means they are not a good hedge, So you will be forced to take heavy losses on the short, near term calls, you will either have to keep rolling those over for a loss while you wait for the long term calls deltas to catch up and begin to act as a dollar for dollar hedge. Without studying this as carefully as I should to make a decision, I think that he is not appreciating that the long term calls will not rise fast enough to make a good hedge. At a glance, this is what I think he has not figured out. Yes he is right, rolling is gonna kill him, But I would really need to study this carefully to make that call for sure and I am probably not going to study it any more, I don't think he is going down the right path with this one. I don't study bad ideas any longer than I have to. |
|
|
|
Post by walnut on Jan 11, 2017 9:20:26 GMT -5
Also, I don't think that he is paying any attention to the options PRICES. You cannot pay 200% what an option is worth statistically. That means that on a pure risk adjusted basis it is too expensive mathematically to work.
|
|
|
|
Post by theMist on Jan 11, 2017 9:33:49 GMT -5
Thanks Huh for the tips. Question: How do you save your work? If you look at my chart above, you'll see CLOSED and as soon as I refresh to get real-time, all my work disappears. I'm signed in as well.
|
|
|
|
Post by theMist on Jan 11, 2017 9:35:32 GMT -5
Fully understood Walnut. Your knowledge is very impressive and I'm learning.
So back to the drawing board. lol
|
|
|
|
Post by huh on Jan 11, 2017 9:36:34 GMT -5
Thanks Huh for the tips. Question: How do you save your work? If you look at my chart above, you'll see CLOSED and as soon as I refresh to get real-time, all my work disappears. I'm signed in as well. I think you have to create an account to do that. I haven't done that yet. |
|
|
|
Post by huh on Jan 11, 2017 9:36:59 GMT -5
Looks like AAPL's going to try for a move to ~120.50
|
|
|
|
Post by novie08 on Jan 11, 2017 9:39:47 GMT -5
Jeff Gundlach says the bond bull market is dead if the 10-year hits 3.00%. During the presentation of his 2017 outlook, Gundlach said a move to 3.00% and above would have "a real impact on market liquidity in corporate bonds and junk bonds."
Will this drive more money into equities? The bond markets are huge.
|
|
|
|
Post by huh on Jan 11, 2017 9:42:25 GMT -5
Jeff Gundlach says the bond bull market is dead if the 10-year hits 3.00%. During the presentation of his 2017 outlook, Gundlach said a move to 3.00% and above would have "a real impact on market liquidity in corporate bonds and junk bonds." Will this drive more money into equities? The bond markets are huge. Looks like a bullish bottoming pattern forming in TLT. |
|
|
|
Post by huh on Jan 11, 2017 9:47:02 GMT -5
Gotta run. BOL all
|
|
|
|
Post by theMist on Jan 11, 2017 9:52:47 GMT -5
With each day that passes - the more this market (S&P) stays flat and grinds slightly higher to better form that RS - the more VXX, UVXY, TVIX is going to have downward pressure. Amazingly, they're still hanging in there. UVXY only down a whopping 3 cents. lol
We need that S&P H&S pattern to form completely and then get a fast, hard break to downside.
Boring day so far...
|
|
|
|
Post by walnut on Jan 11, 2017 9:54:58 GMT -5
Fully understood Walnut. Your knowledge is very impressive and I'm learning. So back to the drawing board. lol Well, I hope you weren't on board with that idea too much. Work with me and maybe this year we can find an idea that does work. |
|