|
|
Post by theMist on Nov 12, 2018 8:14:21 GMT -5
Jim's video
This past week was just a continuation of the previous week UNITL Friday. On Friday, the completely EXPECTED thing started to happen -
a reaction to anticipated resistance at the same level we hit in the middle of October before we started down in the descending broadening pattern.
Now the task is very simple and direct. We look to see where the chart finds support and if we return to that possible neck line at about 2820.
If we get OVER that level then 3050 is back on the table...
|
|
|
|
Post by walnut on Nov 12, 2018 9:32:53 GMT -5
That hourly stochastic that was giving us trouble most of the day Friday has finished. If VXX goes up again today it's just because it wants to...
|
|
|
|
Post by theMist on Nov 12, 2018 9:53:36 GMT -5
S&P Hourly Chart Now that's a neckline backtest on cash charts just question of whether it overshoots now  |
|
|
|
Post by huh on Nov 12, 2018 11:28:25 GMT -5
Wow, not what I expected, that's for sure. There is the possibility of the larger iH&S in S&P that Mist has already posted about with Jim's videos, but that support doesn't come up for a while yet (2707-2725):  When I first saw the potential for that pattern I dismissed it because it's unusual to see an iH&S with a nearly perfect horizontal neckline - usually only see these after a major downtrend, and usually it would take a very long time to form, not a few days - I wouldn't consider October's pullback a major downtrend, and not much consolidation since. OTH, same potential pattern in NDX with a sloped neckline: 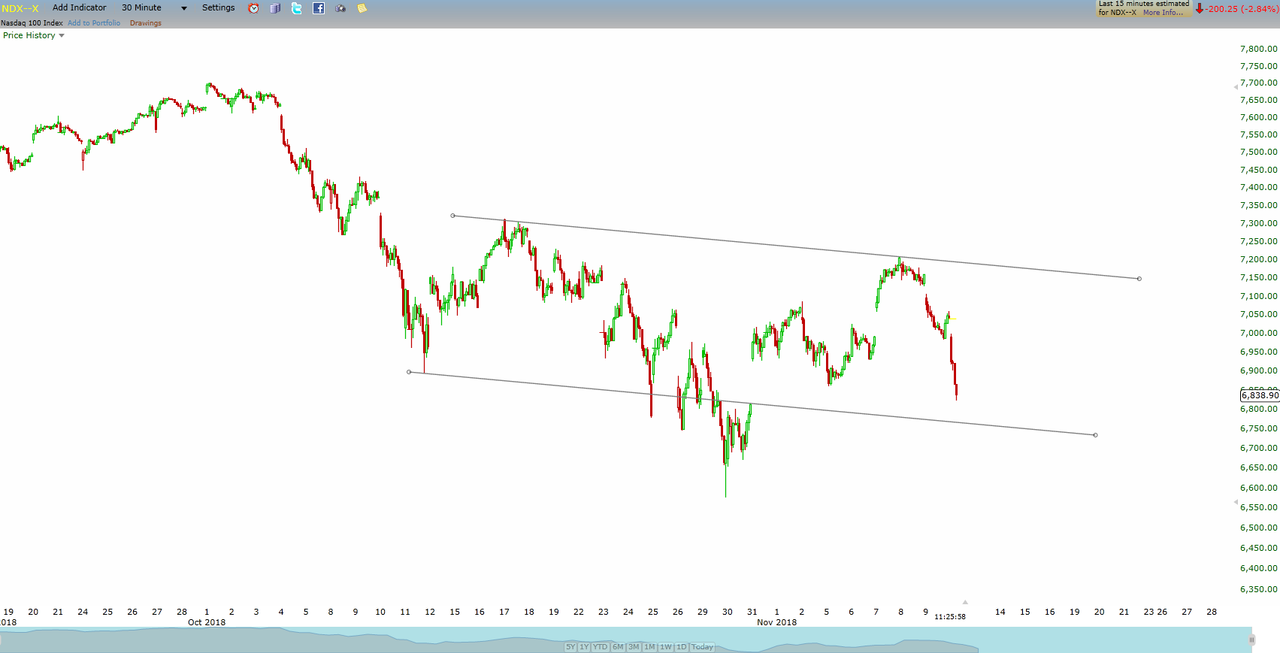 And IWM: 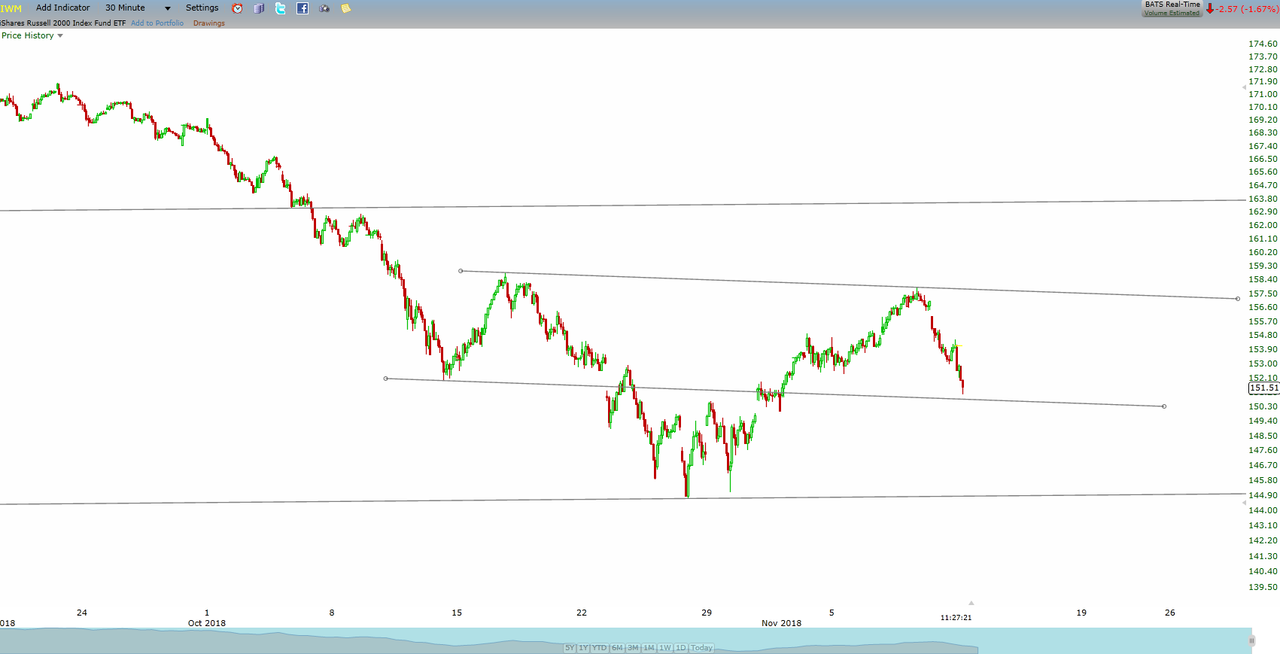 |
|
|
|
Post by huh on Nov 12, 2018 11:30:18 GMT -5
I'm only showing the patterns above as potential supports - not so sure I actually believe in them. Keep an eye on IWM though as it would tag its support first and could be an indicator of whether or not these potential IH&S patterns are actually in play or not.
|
|
|
|
Post by theMist on Nov 12, 2018 13:29:27 GMT -5
Good charts Huh
This backtest Friday and today has been nasty that's for sure
And this move can get down to low 2700 and still be a possible large iH&S
But man these swings are extreme!!!
Dow swings 1k pts and SP like 100 pts like candy lol
Would really like to see SP2732 be the end of this pullback with markets turning back up now
|
|
|
|
Post by huh on Nov 12, 2018 14:19:36 GMT -5
I was sort of hoping for a 5% up day, but in hindsight, perhaps I was being a little optimistic.
Bwahahaha
Actually, I was thinking we might see SPX 2880's-2925 either Friday or next week Monday. (IWM ~163.60)
|
|
|
|
Post by walnut on Nov 12, 2018 14:20:52 GMT -5
Hopefully we are finishing a nice H&S on VXX with this move and we are putting this correction in the rear view mirror soon.
|
|
|
|
Post by huh on Nov 12, 2018 14:25:22 GMT -5
If we were to see a sudden rise here, as in 5%+ within a short time, I would think that might spell more of a long term top. But I'm pretty much a perma-bear so long as S&P's Shiller PE ratio is above 1929's black Tuesday's ratio.
|
|
|
|
Post by walnut on Nov 12, 2018 15:20:00 GMT -5
I think Mist went back down in the bunker
|
|
|
|
Post by clinton on Nov 12, 2018 15:43:03 GMT -5
MARKET IS SHIT
STAY BEARISH
|
|
|
|
Post by theMist on Nov 12, 2018 16:07:47 GMT -5
It's possible the iH&S can still be in play even with a move down to low SP2700 area
S&P really needs to retake that neckline SP2760 area
My gut is telling me that this whole year is a market top
But its early to call...
In meanwhile, VXX could be headed to 38 range
|
|


