|
|
Post by theMist on Nov 4, 2018 19:16:53 GMT -5
Jim's video
Last week we managed to get the S&P up and over two lines of resistance that had been working for quite a while and whose defining points
were unmistakable. Now we start this next week off with signs that we could be reversing back up. Where to? Not sure at this point.
I think we just need to let the chart show us. First, we want to see some more gains either before or after a potential back test of the lines
we got over. Second, we then start to look for a short term top just in case the S&P fails to set a new all-time high. In that case, we could
be looking at a more significant topping pattern. Too soon to know right now...
|
|
|
|
Post by huh on Nov 5, 2018 7:53:17 GMT -5
Upside resistance still ~2767 - need a close above to confirm October pullback wasn't the beginning of a larger topping pattern. One last major resistance to clear now to confirm if the recent down move is actually dead, or if this pop is only a dead cat bounce...S&P ~2767:  Note the high of the recent pop was just enough to fill an upside gap. Critical support moves up to ~2639.75. A close below this would spell big trouble for bulls (remember the whole every major top/bottom in March or October since '94 phenomenon? A close below that support could set-up a double-top for S&P down to 2230's) 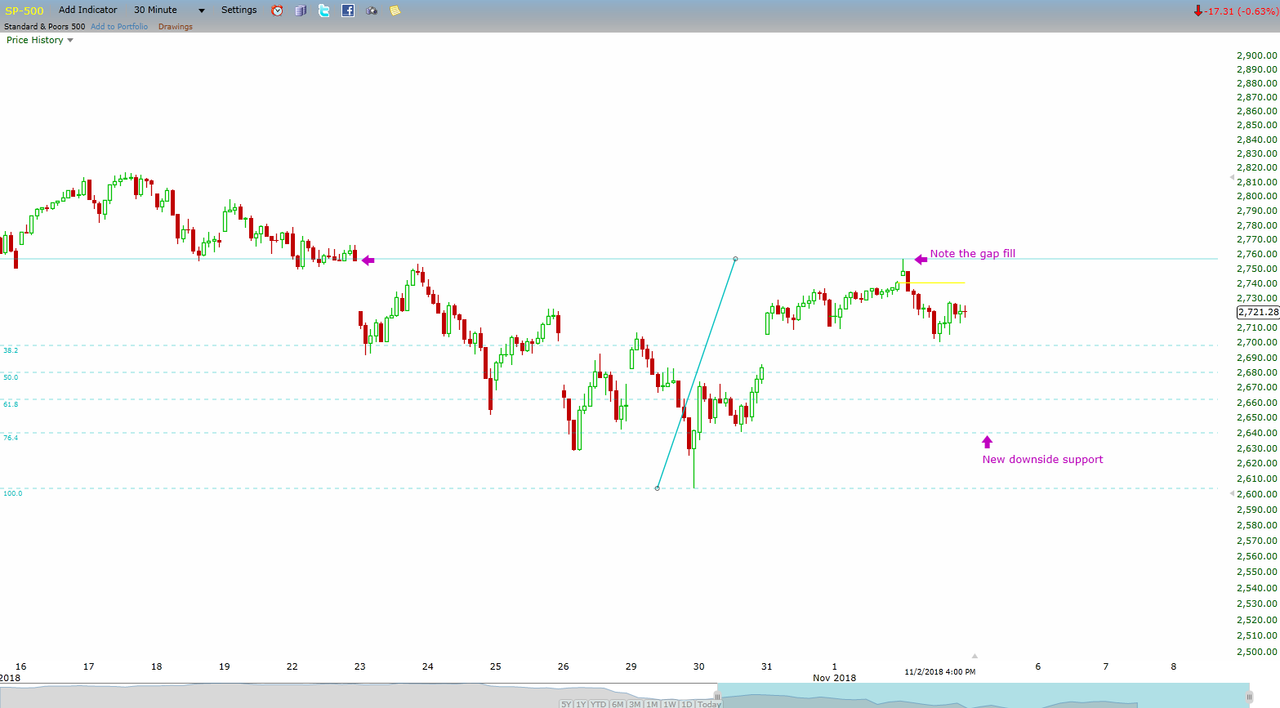 JMHO & BOL |
|


