|
|
Post by clinton on Apr 20, 2018 9:32:47 GMT -5
5 min OBV is showing more selling than buying on many names
Im guessing this market drops
|
|
|
|
Post by clinton on Apr 20, 2018 9:40:27 GMT -5
Look at how bearisg GE 5M OBV is 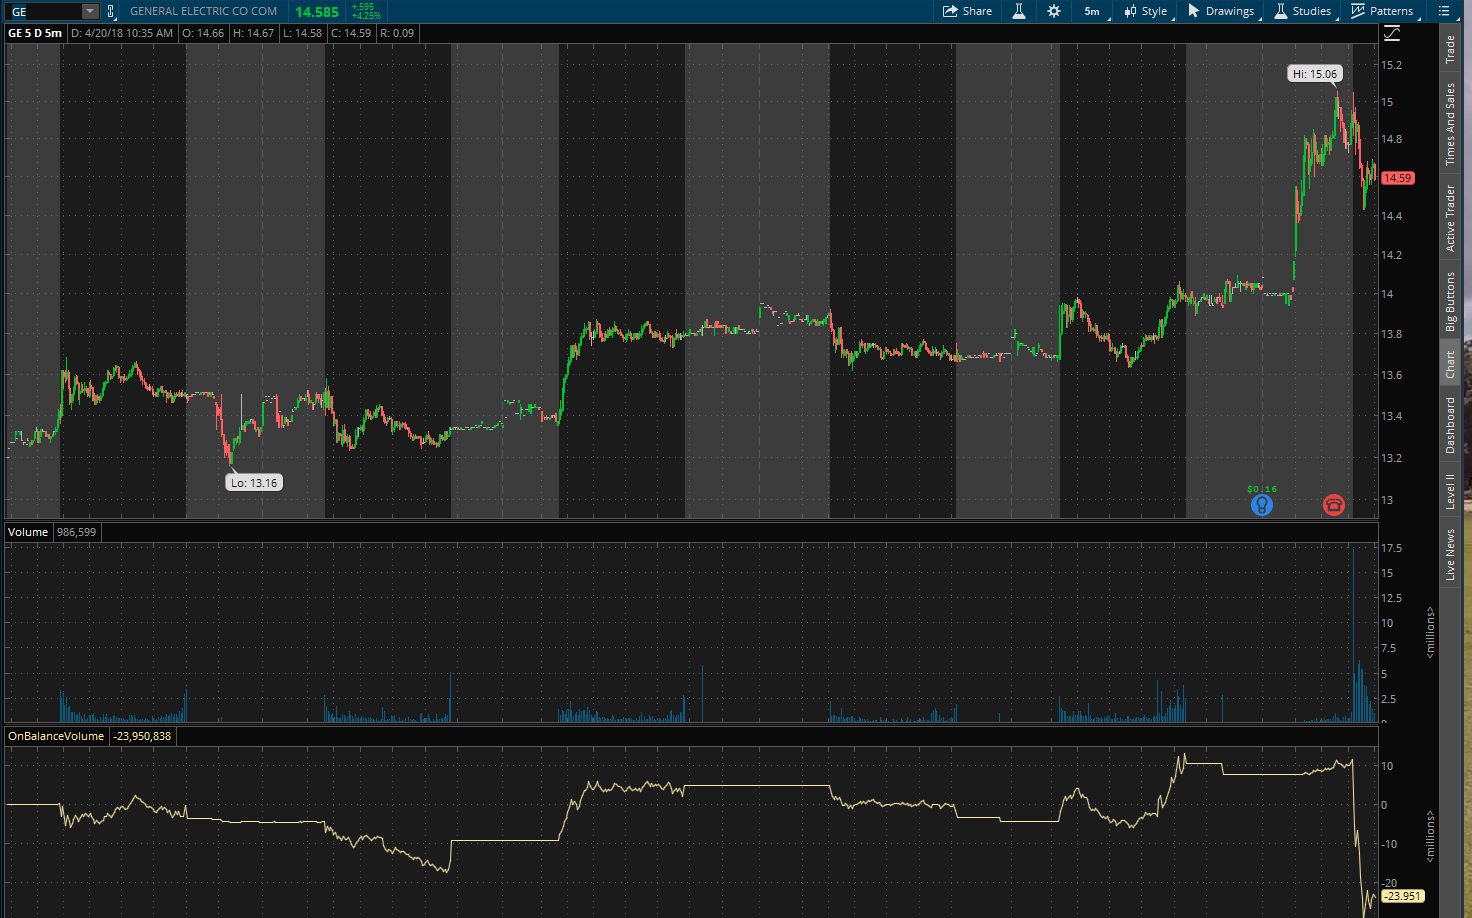 thats crazy and seldom happens |
|
|
|
Post by clinton on Apr 20, 2018 9:57:12 GMT -5
last buy
$PVG $7 calls for .52
|
|
|
|
Post by dino on Apr 20, 2018 10:09:04 GMT -5
Sorry guys - I rarely post anymore (that thing called work gets in the way) but wanted to point out something you might want to consider adding to your list of indicators on market direction:
$TICK - The Tick Index indicator shows the number of stocks trading on an uptick minus the number of stocks trading on a downtick. Positive = bullish, Negative = bearish.
$TRIN - The TRIN (Trader's Index) indicator is a technical analysis indicator calculated by dividing the advances-to-declines spread by the volume of advances to declines. Positive = bearish, Negative = bullish.
These help me determine how strong the moves are.
Mist - I see your iH&S as well. I think a successful back test of that neckline is the second confirmation this correction is over. The first was the hold of that long term bullish up channel imo.
That neckline doesn't hold and we may revisit low.
All my opinion - hope everybody is doing well...
|
|
|
|
Post by walnut on Apr 20, 2018 10:35:30 GMT -5
Check in more often Dino
Thanks for the info above
|
|
|
|
Post by theMist on Apr 20, 2018 10:37:20 GMT -5
yes nice to see you Dino
|
|
|
|
Post by clinton on Apr 20, 2018 10:57:00 GMT -5
OK I bought a silly lotto ticket
$NOK $5 put for .03 haha
|
|
|
|
Post by theMist on Apr 20, 2018 11:10:32 GMT -5
VXX 15min Next rollover and test of that rising support should be the real move IMO just a question of when  |
|
|
|
Post by clinton on Apr 20, 2018 11:15:10 GMT -5
GE is melting like ice cream on a hot day
|
|
|
|
Post by dino on Apr 20, 2018 11:57:23 GMT -5
SPX neckline back test. In upro 133.65. I hate physical stops but I'll put one in a buck or so below as I can't watch.
Doesn't look good - TICK's still negative though not much. For a iH&S neckline back test, it would be nicer to see some +700-800-900 TICKS (strong buying) instead of the -100-200 (weak selling) that are currently showing.
Looks like buyers indecisive.
|
|
|
|
Post by clinton on Apr 20, 2018 12:18:31 GMT -5
And one last one
$CLF $8 PUT for .57
|
|
|
|
Post by theMist on Apr 20, 2018 12:33:35 GMT -5
S&P Buyers finally stepping in with this hourly candle
|
|
|
|
Post by theMist on Apr 20, 2018 12:34:50 GMT -5
VXX 15 min chart  |
|
|
|
Post by theMist on Apr 20, 2018 12:39:55 GMT -5
S&P Hourly Chart  |
|
|
|
Post by theMist on Apr 20, 2018 14:20:55 GMT -5
Suckas won't let VXX drop today -- will try again next week...
Have a good weekend all
|
|
|
|
Post by clinton on Apr 20, 2018 15:03:29 GMT -5
what a day
PVG call up 11%
NOK put flat
GE put up 33%
CLF PUT +15%
only stinkers are PIR calls
I think Im going to like options
|
|
|
|
Post by walnut on Apr 20, 2018 20:19:22 GMT -5
I'd say that's a good day
|
|
|
|
Post by dino on Apr 23, 2018 19:50:28 GMT -5
SPX neckline back test. In upro 133.65. I hate physical stops but I'll put one in a buck or so below as I can't watch. Doesn't look good - TICK's still negative though not much. For a iH&S neckline back test, it would be nicer to see some +700-800-900 TICKS (strong buying) instead of the -100-200 (weak selling) that are currently showing. Looks like buyers indecisive. Still holding but not liking VXX trading above it's daily 200 day sma. Grrrr.... |
|
|
|
Post by walnut on Apr 23, 2018 21:15:44 GMT -5
SPX neckline back test. In upro 133.65. I hate physical stops but I'll put one in a buck or so below as I can't watch. Doesn't look good - TICK's still negative though not much. For a iH&S neckline back test, it would be nicer to see some +700-800-900 TICKS (strong buying) instead of the -100-200 (weak selling) that are currently showing. Looks like buyers indecisive. Still holding but not liking VXX trading above it's daily 200 day sma. Grrrr.... Nice drop coming tomorrow |
|
|
|
Post by dino on Apr 24, 2018 11:21:15 GMT -5
SPX neckline back test. In upro 133.65. I hate physical stops but I'll put one in a buck or so below as I can't watch. Doesn't look good - TICK's still negative though not much. For a iH&S neckline back test, it would be nicer to see some +700-800-900 TICKS (strong buying) instead of the -100-200 (weak selling) that are currently showing. Looks like buyers indecisive. Still holding but not liking VXX trading above it's daily 200 day sma. Grrrr.... Added in the 131s. Don't want to see a close below that neckline. |
|


