|
|
Post by huh on Mar 10, 2017 9:28:18 GMT -5
As for a possible major topping pattern in SPX? In the big picture I see a major topping pattern that's only getting a final squeeze (below). And when you consider current margin debt and pe valuations, especially Shiller pe, as compared to previous market tops, well, you get the potential for a 1929 or 1987 type scenario.  |
|
|
|
Post by huh on Mar 10, 2017 9:32:01 GMT -5
Huh, take a look at this VXX chart...If VXX 17.24 is the real neckline area, then guess what -- VXX threw back above its neckline and is possibly putting in a small bottom pattern (iH&S) and this can change the entire picture... Good eye, Mist. And if it is an iH&S in VXX, and it were to dive down for a slightly lower low (perhaps ~16.20?) to complete a head test of the iH&S, then that would line up with both my call for a VX downside gap fill and the larger topping pattern in S&P |
|
|
|
Post by theMist on Mar 10, 2017 9:35:05 GMT -5
ES back in that channel and under that shoulder test line....
looking to scalp shorting SCAMs when/if they are solid green
|
|
|
|
Post by huh on Mar 10, 2017 9:36:43 GMT -5
ES back in that channel and under that shoulder test line.... Wait to see how it does in the 2371.30-2372.75 range - that would be the shoulder test line set lower as I'd draw it |
|
|
|
Post by theMist on Mar 10, 2017 9:38:27 GMT -5
ES back in that channel and under that shoulder test line.... Wait to see how it does in the 2371.50-2372.50 range - that would be the shoulder test line set lower as I'd draw it I see it -- you have your shoulder line horizontal where mine is slightly slanted. If S&P keeps selling like this, will be below both our shoulder line tests. lol |
|
|
|
Post by huh on Mar 10, 2017 9:39:55 GMT -5
Wait to see how it does in the 2371.50-2372.50 range - that would be the shoulder test line set lower as I'd draw it I see it -- you have your shoulder line horizontal where mine is slightly slanted. If S&P keeps selling like this, will be below both our shoulder line tests. lol No, I have the same slope, only setting the upper line across the highs made before the first significant low - before the first point of the neckline. |
|
|
|
Post by theMist on Mar 10, 2017 9:40:21 GMT -5
Backtesting channel break If VXX goes green in next 5 mins and closes green that won't be good for short VXX VXX does have a red hollow on 5 min chart and its completely outside its lower BB  image hosting 10mb limit image hosting 10mb limit |
|
|
|
Post by lasvegas77 on Mar 10, 2017 9:43:05 GMT -5
accidentally set my alarm to 5:28pm instead of am. But ended up getting more sleep i suppose.
|
|
|
|
Post by huh on Mar 10, 2017 9:44:11 GMT -5
Wait to see how it does in the 2371.50-2372.50 range - that would be the shoulder test line set lower as I'd draw it I see it -- you have your shoulder line horizontal where mine is slightly slanted. If S&P keeps selling like this, will be below both our shoulder line tests. lol Oh, I see what it is now - there's 2 potential H&S's here. Either way, I hope the market straight up squeezes all of this recent action. Because then we wouldn't have to worry about which it is, or how to draw the lines - it would simply be a blow-off top IMO. |
|
|
|
Post by theMist on Mar 10, 2017 9:45:03 GMT -5
Be carfeful shorting VIX SCAMs
Red hollow outside its lower BB on 5 min chart
Can fly
S&P also has topping candle completely outside its upper BB (and its a shooting star with solid filled body) on 15 min chart -- but needs confirmation
S&P topping candle so far not getting confirmation and is being followed by solid green candle
|
|
|
|
Post by lasvegas77 on Mar 10, 2017 9:51:50 GMT -5
That was quite a spike from the pre market low on vxx. they love to run the stops on the shorts lately.
|
|
|
|
Post by huh on Mar 10, 2017 9:52:42 GMT -5
VXX lost the shoulder test line again of the potential iH&S. I think it will now go down for a lower low head test.
This is what's so cool about charting. If you closely analyze an iH&S, for example, you'll see that the shoulders are made up of larger but failed bull flags (which are made up of smaller & successful bull flags). And those bull flags are FIB retracements (which is why I think of the FIBs as the "spine" of all the patterns). And if you get a head test of an iH&S, then the whole thing simply becomes a double bottom that had a lot of consolidation on the first bottom that got a final squeeze with the second bottom (the head test).
|
|
|
|
Post by theMist on Mar 10, 2017 9:53:55 GMT -5
That may have been the HOD for VXX and missed going green by 2 cents
But have to see if they hit the sell button again in S&P
With S&P pullback - they bought the dip so far
|
|
|
|
Post by theMist on Mar 10, 2017 9:55:55 GMT -5
VXX lost the shoulder test line again of the potential iH&S. I think it will now go down for a lower low head test. This is what's so cool about charting. If you closely analyze an iH&S, for example, you'll see that the shoulders are made up of larger but failed bull flags (which are made up of smaller & successful bull flags). And those bull flags are FIB retracements (which is why I think of the FIBs as the "spine" of all the patterns). And if you get a head test of an iH&S, then the whole thing simply becomes a double bottom that had a lot of consolidation on the first bottom that got a final squeeze with the second bottom (the head test). So you think VXX will fall short of breaking below VXX 16.87 and put in double bottom? VXX 17.05 VXX has been in such a tight range these past few days and has not made a directional move in quite some time |
|
|
|
Post by huh on Mar 10, 2017 9:56:26 GMT -5
Look at where ES is holding against the neckline where I have it... 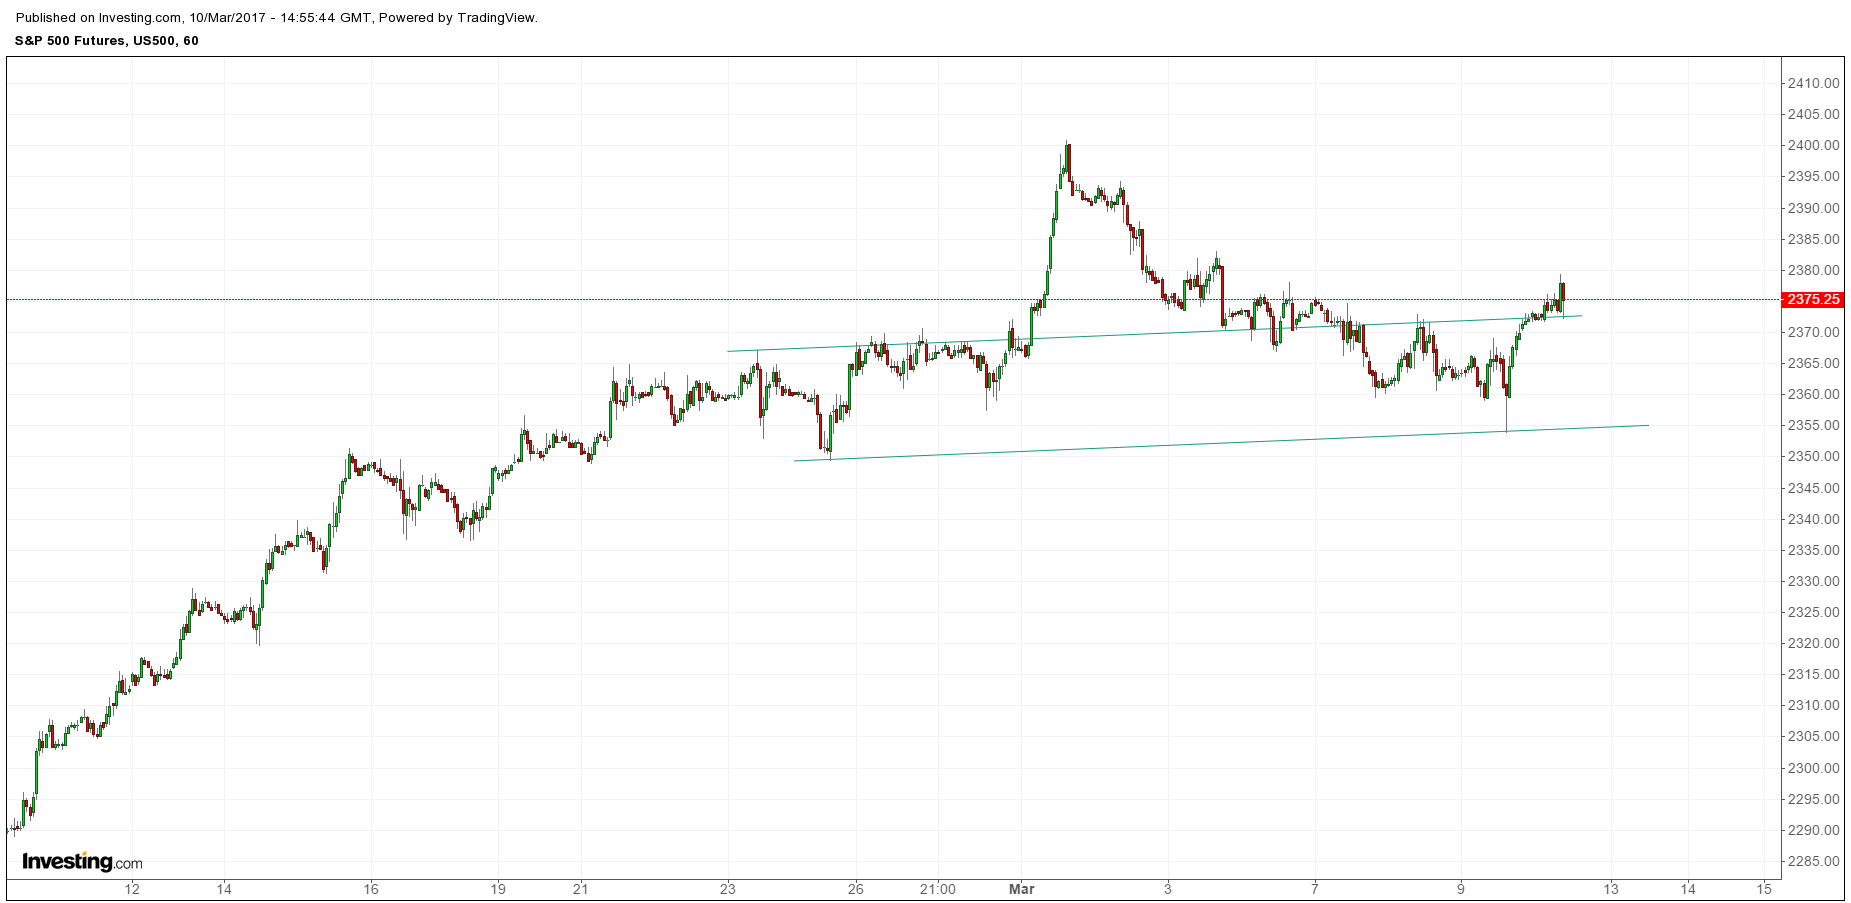 |
|
|
|
Post by huh on Mar 10, 2017 9:56:46 GMT -5
VXX lost the shoulder test line again of the potential iH&S. I think it will now go down for a lower low head test. This is what's so cool about charting. If you closely analyze an iH&S, for example, you'll see that the shoulders are made up of larger but failed bull flags (which are made up of smaller & successful bull flags). And those bull flags are FIB retracements (which is why I think of the FIBs as the "spine" of all the patterns). And if you get a head test of an iH&S, then the whole thing simply becomes a double bottom that had a lot of consolidation on the first bottom that got a final squeeze with the second bottom (the head test). So you think VXX will fall short of breaking below VXX 16.87 and put in double bottom? VXX 17.05 No, I think it will make a lower low head test - it has to if VX is to fill it's downside gap ~11.70 |
|
|
|
Post by theMist on Mar 10, 2017 9:58:32 GMT -5
VXX is still in that descending channel and that H&S does measure low 16s
we'll see...
|
|
|
|
Post by huh on Mar 10, 2017 9:59:07 GMT -5
I think VXX will see down to at least 16.20 (target of smaller H&S I showed in chart earlier with gray lines). VX down to 11.72 could put VXX somewhere around 15.90-16.20.
|
|
|
|
Post by lasvegas77 on Mar 10, 2017 9:59:32 GMT -5
I said it yesterday when the market was weak. I expect new snp highs before a real correction comes. At the same time, I am cautious about next week.
|
|
|
|
Post by walnut on Mar 10, 2017 10:00:54 GMT -5
Mist are you short any yet
I'm not, wondering about next SnP candle
Well I am 5200 short TVIX only still
|
|


